Seasonality plays a role in a 2% decline in total TV usage during the month
Seasonality plays a key role in TV viewing, and so do high-profile sporting events. March was no exception in both cases, as total TV usage declined, but the onset of NCAA basketball playoffs provided a seasonal bump to cable viewing. In fact, the arrival of March Madness gave cable its biggest boost since last year’s tournament—and its first uptick since August 2022. Cable was also the lone gainer in the month, with viewing up 0.6%.
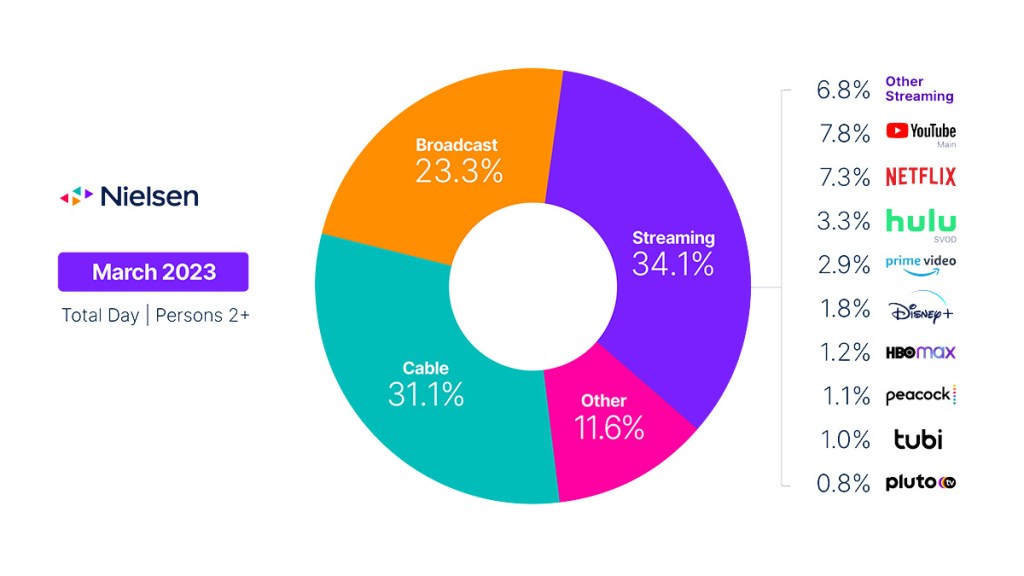
The appeal of the tournament among sports fans highlights the impact that high-demand content has on viewership, regardless of platform or channel. Outside of March Madness, TV viewing trends in the month were in line with seasonal trends, with total usage down 2% from February 2023.
The 95th Oscars fueled a 153% increase in the award/ceremonies category on broadcast, but it, along with a 2.7% increase in drama viewing, wasn’t enough to offset declines in news (-4.4%) and sitcom (-8.1%) viewing. Outside of sports, which accounted for 9.5% of cable usage in March, viewing trends on cable were similar, with feature film and news viewing down 5.1% and 6.7%, respectively. On a year-over-year basis, cable viewing was down 13.7% (5.9 share points).
While streaming lost only 0.2 share points in March, the dip represents streaming’s first loss of share since August 2022, when it dropped 0.1 point at the onset of NCAA and NFL football. Since then, it has grown its share four times and remained flat twice. Yet while streaming usage was down 2.6% since February, the category is still up by more than a third on a year-over-year basis (almost 8 share points).
Across platforms, Pluto TV was the biggest gainer, as a 4.6% increase in usage pushed its share back up to 0.8%. Peacock viewing increased 3.1% to set a high water mark of 1.1% in total TV usage. Other notable streaming highlights include:
- Viewers watched more than 4.7 billion minutes of Outer Banks on Netflix.
- The new season of The Mandalorian on Disney+, with new episodes released weekly, attracted more than 3.6 billion viewing minutes, making it the second-most streamed program in March.
- You generated almost 3.6 billion viewing minutes on Netflix.
- YouTube, excluding YouTube TV, remained the most-used platform, claiming 7.8% of total TV usage.
March data trends with Brian Fuhrer
Methodology and frequently asked questions
The Gauge provides a monthly macroanalysis of audience viewing behaviors across key television delivery platforms, including broadcast, streaming, cable and other sources. It also includes a breakdown of the major, individual streaming distributors. The chart itself represents monthly total television usage, broken out into share of viewing by category and by individual streaming distributors.
How is ‘The Gauge’ created?
The data for The Gauge is derived from two separately weighted panels and combined to create the graphic. Nielsen’s streaming data is derived from a subset of Streaming Meter-enabled TV households within the National TV panel. The linear TV sources (broadcast and cable), as well as total usage are based on viewing from Nielsen’s overall TV panel.
All the data is time period based for each viewing source. The data, representing a broadcast month, is based on Live+7 viewing for the reporting interval (Note: Live+7 includes live television viewing plus viewing up to seven days later for linear content).
What is included in “Other”?
Within The Gauge, “other” includes all other TV usage that does not fall into the Broadcast, Cable or Streaming categories. This primarily includes all other tuning (unmeasured sources), unmeasured video on demand (VOD), streaming through a cable set top box, audio streaming, gaming and other device (DVD playback) use. Because streaming via cable set top boxes does not credit respective streaming distributors, these are included in the “other” category. Crediting individual streaming distributors from cable set top boxes is something Nielsen continues to pursue as we enhance our Streaming Meter technology.
What is included in “other streaming”?
Streaming platforms listed as “other streaming” includes any high-bandwidth video streaming on television that is not individually broken out. Apps designed to deliver live broadcast and cable (linear) programming (VMVPD or MVPD applications like Sling TV or Charter/Spectrum) are excluded from “other streaming.”
Where does linear streaming contribute?
Linear streaming (as defined by the aggregation of viewing to vMVPD/MVPD apps) is excluded from the streaming category as the broadcast and cable content viewed through these apps credits to its respective category. This methodological change was implemented with the February 2023 interval.
What about live streaming on Hulu and YouTube?
Linear streaming via vMVPD apps (e.g., Hulu Live, YouTube TV) are excluded from the streaming category. ‘Hulu SVOD’ and ‘YouTube Main’ within the streaming category refer to the platforms’ usage without the inclusion of linear streaming.