Radio reaches nearly all Americans, in nearly every place they go, on every device. A medium that big deserves measurement that captures all of it.
In the era of constant digital scrolling and fragmented attention, it’s easy for marketers to be lured by the “new and next.” We often prioritize platforms based on how easily we can track a click, sometimes forgetting that ease of measurement doesn’t always equal effectiveness. Yet there is a legacy powerhouse that continues to outperform nearly every other medium in the one metric that matters most: actual human reach. That’s radio.
Two words sum up radio’s advantage: everyone and everywhere. They also set the bar for how radio has to be measured.
Part one: The case for radio
Everyone
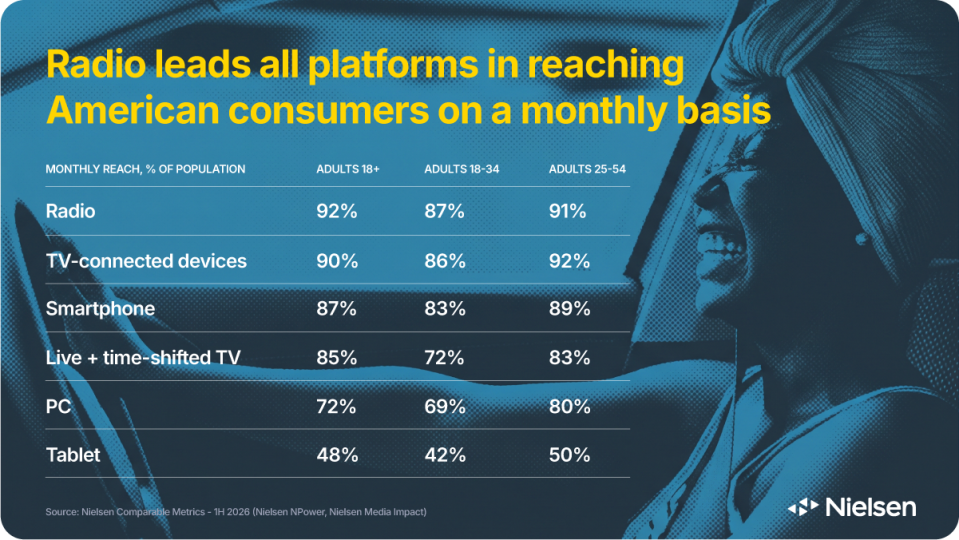
Every month, radio reaches 92% of U.S. adults, or more than 242 million consumers, a larger share than TV-connected devices (90%), smartphones (87%), or live and time-shifted TV (85%).1 It reaches 92% of Black adults, 93% of Hispanic adults and 87% of adults 18-34, the group most often written off as “digital only.”
Every day
Americans spend nearly four hours a day with audio. Of the ad-supported time advertisers can actually buy, radio and podcasts account for 82%, while streaming music services account for only 16%.2 An audio plan built without both radio and podcasts misses most of the audience.
Everywhere
Radio is primarily (but not exclusively) an away-from-home medium: 65% of adult radio listening happens outside the home, and most of that happens in the car, rising to 73% during weekday drive times.3 That puts radio in the ear of consumers closest to the point of purchase. In the car, more than 80% of all ad-supported audio time goes to AM/FM radio.4
Drivers intend to keep it that way. In a May 2026 Nielsen study conducted with iHeartMedia, around half of car buyers said they would refuse to buy a vehicle without AM/FM radio, and more than 7 in 10 said it should come standard.5 In a conjoint analysis modeling real purchase tradeoffs, AM/FM ranked second only to smartphone integration in its influence on vehicle choice. Two-thirds say zero latency matters for live sports, where a stream can trail the action.
Outside the car, the other 35% of listening time happens across the myriad of devices that are synced to our lives: phones, smart speakers, computers, tablets and so on. Radio is the original portable media, reaching consumers on the job, in the store, at the gym and anywhere you can bring a digital audio device.
Underrated
Marketers are shifting investment toward digital channels they perceive as more effective, largely because those channels are easier to attribute.6 Nielsen’s Global Compass benchmarks told a different story. Those marketers ranked radio last of ten channels in perceived effectiveness, yet it delivered a weighted ROI of $2.00, second only to social media at $2.22 and ahead of TV, display, search and CTV.7 Podcasts performed well too, at $1.49, comparable to TV and display. The lesson is to scale into digital without substituting away from high-reach, high-return platforms like radio.
Part two: A medium this big needs measurement this complete
“Everyone, everywhere” describes radio’s audience. It is also the standard its measurement has to meet. If radio reaches 92% of adults at home, at work and in the car, the measurement behind billions of dollars in audio buying has to capture every one of those listeners and represent them accurately.
We follow the listener, not the device
In the 48 largest markets, Nielsen’s wearable Portable People Meter passively detects codes embedded in station audio, wherever the panelist goes, including the car. A motion sensor confirms the meter is worn, and the average adult wears it about 14 hours a day.8 Since January 2025, a three-minute listening qualifier has credited more of the short listening occasions around ad breaks, raising measured average audience by 24% on average.9 In more than 200 additional markets and outlying counties, diaries record where listening happens, also including the car. Nielsen Audio captures radio listening in every county in the United States.
Samples built to represent everyone
Nielsen builds random, address-based samples weighted to U.S. Census figures by geography, age, gender and ethnicity, designed to reach the hardest-to-measure groups.8 That’s why advertisers can trust that radio’s reach among Black and Hispanic audiences is reflected in the numbers they buy on. Nielsen is also independent: in PPM markets, listening is measured whether or not a station subscribes, and the diary service has held Media Rating Council accreditation since 1968.
The whole ecosystem, in one system
Nielsen measures radio, podcasts and streaming audio together, from local stations to national networks, where Nielsen Nationwide is the network radio currency. Because the data live in one system, planners can model platforms together: radio alone reaches 88% of adults 18-34, and adding podcasts brings coverage to 94%.10
Click here to learn more about Nielsen’s audio measurement methodology.
Back to the car: scale is not the same as representation
Connected vehicles now generate large volumes of listening data, and Nielsen uses big data. But in-car data on its own reveals what a head unit was tuned to, not who was listening. It typically can’t tell a driver from a passenger, count the people in the car or verify their demographics, and it reflects only the vehicles that report it, often newer models with data sharing turned on. Millions of vehicles on the road today are not captured by in-car data: older vehicles, delivery vans, professional services vehicles, semi trucks, cabs…the list goes on and on. This is a huge blind spot.
Nielsen anchors large data sets to verified human behavior from proportional, census-informed panels, so added scale brings added precision instead of added bias. Any in-car data set offered as a standalone basis for buying radio deserves rigorous review: who is in the sample, how it is weighted, and whether it measures people or devices.
Everyone. Everywhere.
Radio reaches more Americans each month than any other platform, leads ad-supported listening, dominates the car and delivers some of the strongest returns marketers can buy. A medium that is everywhere and reaches everyone needs measurement that gathers it all. That’s what Nielsen Audio delivers.
For more audio data and insights, explore Nielsen’s audio measurement solutions.
Sources
- Nielsen Comparable Metrics – 1H 2026 (Nielsen NPower, Nielsen Media Impact)
- Nielsen, The Record: Q1 2026 U.S. audio listening trends, June 2026; Edison Research Share of Ear®, Q1 2026. Ad-supported audio includes AM/FM radio (over-the-air and streamed), podcasts, ad-supported streaming music and ad-supported satellite radio channels. Analysis does not include listening to music/music videos on YouTube.
- Nielsen National Regional Database, Adults 18+, Q2 2025. Location detail based on Audio Diary markets only.
- Edison Research Share of Ear®, Q2 2026
- Nielsen In Car Radio Study in partnership with iHeartMedia, May 2026; n=1,000+ recent and prospective car buyers.
- Nielsen 2025 Annual Marketing Report.
- 2025 Nielsen Global Annual Marketing Survey; Nielsen Global Compass Benchmark. Global figures.
- Nielsen Media Knowledge Series Part 3: Audio Measurement & Data; Nielsen Audio Measurement Overview, October 2026.
- Nielsen, Modernizing PPM Audio Measurement: The 3-Minute Qualifier, November 2024.
- Nielsen Podcast Fusion, Nielsen Media Impact; Adults 18-34; March 2025.